stat
c--- id: stat title: Statistics Tab sidebar_label: Statistics Tab
Overview
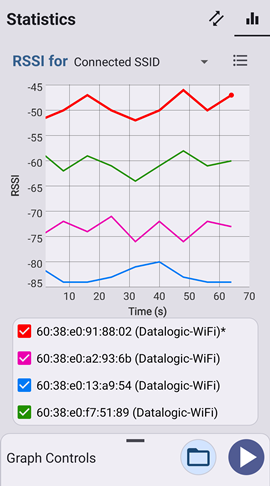
The Statistics tab allows the user to collect information about the Wi-Fi access points that are visible by the device. It reports signal strength, roaming events and detailed information on access points, which can be used to determine the signal coverage of a wireless network. The tab displays a graph of RSSI results, an optional legend, and controls for changing the graph content.
SSID Filter
This pop-up list in the graph title specifies the SSID to use for selecting which access points to include in the graph. Since several access points are often in range of the device as it changes location, this is useful for ignoring APs which are not of interest. The list's contents will update as soon as new SSIDs become visible to the device, and is reset when you start graphing. Two special values in the list are:
-
All SSIDs: This selects all SSIDs (effectively disabling the filter).
-
Connected SSID: This selects any SSID that matches the Wi-Fi network the device is currently connected to. It is the default value. Note that the exact name of the SSID may change if the device roams between two Wi-Fi networks with different SSIDs.
The SSID Filter cannot be changed while graphing is active.
Graph Legend
The button in the upper right corner of the tab ( ) toggles the display of the graph legend. When visible, the legend presents a scrollable list of each access point included in the graph. To help identify each line in the graph, the BSSID and SSID (in parenthesis) for each entry is shown in a color which matches the color of the line drawn in the graph. The visibility of each line can be toggled on/off by using the checkbox of each entry. This can help reduce clutter on graphs which contain a large number of access points.
While graphing new RSSI data, any new access points that become visible are added to the top of the list. The access point that the device is currently connected to is always listed first, and designated with a trailing asterisk ("*").
Graph Controls
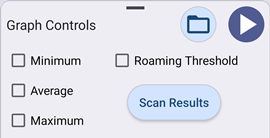
The sheet with the graphing controls is at the bottom of the display and can be expanded by dragging up the gripper at its top center. It can be collapsed by dragging it down. The following controls are available:
-
Graph Storage: This button (
 ) takes you to the Graph Storage screen where you can load and save RSSI graph data as CSV files, as well as share them with other applications (such as e-mail).
 -
Minimum/Maximum/Average RSSI: These three checkbox controls toggle the visibility of additional lines on the graph. These lines represent the calculated minimum, maximum, or average RSSI value over all sampled access points at each point along the graph.
-
Roaming threshold: This checkbox toggles the display of the RSSI threshold used by the device to initiate roaming. When shown, it is represented by a horizontal dashed line.
-
Scan Results: This button takes you to the Scan Results screen where you can see a complete list of APs and detailed information on each of them. It is disabled while graphing is active.
Collecting RSSI statistics
To begin graphing RSSI data, tap the blue Play button. When tapped, the control sheet will automatically collapse to reveal the graph results, and the Play button will change to a Stop button. To stop graphing, tap this button again.
While graphing, the RSSI values of visible access points are displayed in the graph, with each access point shown in a unique color. The graph displays the time of each sample on the horizontal axis, and the RSSI value on the vertical axis. Note that RSSI values are negative, with less negative (i.e. higher) values representing a stronger signal.
The line representing the AP the device is currently connected to (at the time) is drawn slightly thicker than the others. The specific thicker line may change as the device roams between APs. Any gaps in the graphed line represents a period where the access point was out of range.
It is not necessary to be in range of an access point when starting a graph. In this case, no lines will be drawn until an AP is seen. At this point, the lines for those APs will be drawn, and a connect event will also be shown (if it applies).
Once you have collected RSSI graph data and stopped graphing, you can save the data to a file by tapping the gray storage button () which takes you to the Graph Storage screen. If you tap the Play button again without having saved the existing graph data, you will be asked to save or discard the current data before proceeding.
Events
Space at the bottom of the graph is used to display icons which represent various events that can take place while graphing. The possible events and their icons are:
| Event | Description |
|---|---|
 Connect Connect | The device connected to a network. |
 Disconnect Disconnect | The device disconnected from a network. |
 Roam Roam | The device roamed between access points. The APs do not necessarily need to have the same SSID. |
 User Note User Note | The user has added a general annotation to the graph. Tapping the gray Add Note button ( ) while the graph is active will add this event at the current point in the graph. ) while the graph is active will add this event at the current point in the graph. |
If you tap on any of these event icons, you will see a dialog similar to the following:
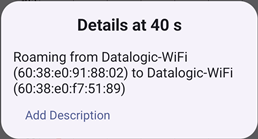
This provides details on the specific event at that time along the graph. If you tap "Add Description", an additional note field is created for the event. This note field can be used to enter additional information about the event, such as the device location or an external event. When finished editing the note, tap "Done" to accept the changes, or "Cancel" cancel them. Event notes may be edited at any time, even with saved files, not only while the graph is active.
Graph Storage
This screen allows you to save and load RSSI graph data. These files are stored as CSV files, which allows you to share them with spreadsheet programs for further examination. You can go back to the Statistics tab by tapping the "X" in the upper right corner, or the Android Back button.
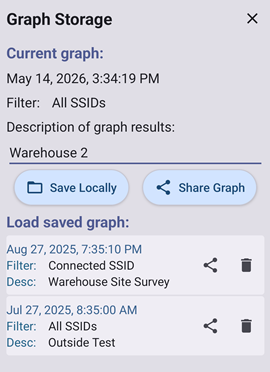
The top portion of the screen relates to the graph currently visible from the main Statistics tab. It includes the following:
-
Date / Time: This is the date and time when the collection of graph data was started.
-
Filter: This shows the value of the SSID filter used to collect the graph data.
-
Description: This field contains a text description of the graph contents. Initially it is blank, but it can be edited by tapping on this field. If the graph data was loaded from a file, it can still be changed and saved again to the file.
-
Save Locally: This button saves the current graph data to a CSV file. An entry will be added to the file list to reflect the new file. If the graph data was already saved, its description will be updated from the Description field when this button is tapped.
-
Share Graph: This button shares the current graph data with other programs that can process plain text CSV files (such as e-mail). When tapped, the file is first saved (if not already saved) before sharing with another application. From there, a system dialog appears to guide you to select which application you wish to share the CSV file with.
Managing graph files
The bottom half of the screen is a list of all previously saved RSSI graph data files. Each entry is listed with the date/time the graph was created, the SSID filter used, and any available description of the graph contents.
To load a file and view its contents, tap the file entry from the list. If the Statistics tab has graph data that has not been saved yet, you will be asked to save or discard this data first, before the new file is loaded. Once loaded, the Graph Storage screen closes and you are returned to the main Statistics tab where the loaded data is displayed.
To share a previously saved file with another application, tap the Share icon ( ) for the file entry. This does not change the currently loaded graph data. To delete a saved file, tap the Delete icon (
 ) for the entry.
Scan Results
This screen displays details about all access points seen by the device. The information can be viewed in one of two forms:
| Format | Description |
|---|---|
 Scan List Scan List | List of APs and details on each of them. |
 Channel Scan Channel Scan | Graphical display of Wi-Fi channel activity. |
To switch between the two views, tap the icon for the alternate view in the upper right corner of the screen. You can go back to the Statistics tab by tapping the "X" in the upper right corner, or the Android Back button.
Scan List
This view of the Scan Results displays a list of all access points seen by the device. The list includes details on each AP, which are regularly updated.
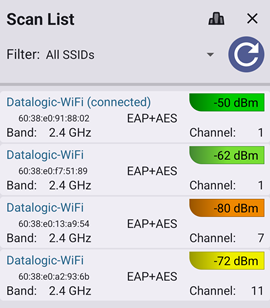
The top of the screen contains controls for the access point list:
-
SSID Filter: This pop-up list specifies the SSID to use for selecting which access points to display in the list. It operates in the same way as the control on the main Statistics tab.
-
Refresh: This button resets the list of access points and initiates a rescan. This is useful if the AP list contains a significant number of entries which are out of range.
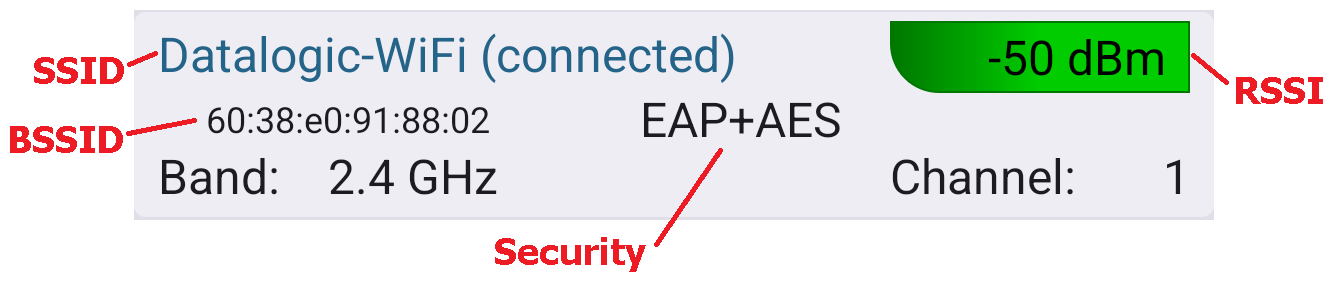
Access Point Entry
Each entry in the access point list contains the following basic information on an access point:
-
SSID / BSSID: These fields uniquely identify the access point in the list. "(connected)" is shown next to the SSID if the device is currently connected to it.
-
RSSI: This field reports the current RSSI value of the access point. The color of this field corresponds to the RSSI level: Red = Low, Yellow = Medium, Green = High. If the access point is out of range, this field displays "Offline".
-
Security: This field displays a summary of security protocols supported.
-
Band: This displays the Wi-Fi band (2.4, 5.0 or 6.0 GHz) currently being used.
-
Channel: This displays the Wi-Fi channel currently being used. If the access point is out of range, this field displays "Offline".
Tapping on an access point entry in the list will take you to the Access Point Details screen where you can see additional details on that AP.
Channel Scan
This view of the Scan Results displays a graph showing the Wi-Fi channels which are actively in use by all access points seen by the device. The display is regularly updated, and APs which are out of range are not displayed. You can go back to the Statistics tab by tapping the "X" in the upper right corner, or the Android Back button.
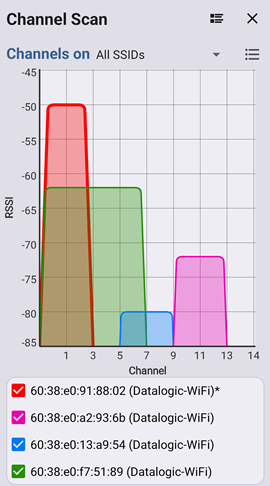
The top of the screen contains controls for the graph:
-
SSID Filter: This pop-up list specifies the SSID to use for selecting which access points to display in the list. It operates in the same way as the control on the main Statistics tab.
-
Graph Legend: This button toggles the display of the graph legend. It operates in the same way as the control on the main Statistics tab. In addition, if you tap and hold on an entry in the list, you will be shown a menu with a Scan Details option. Selecting this option will take you to the Access Point Details screen where you can see additional details on the AP from the legend list.
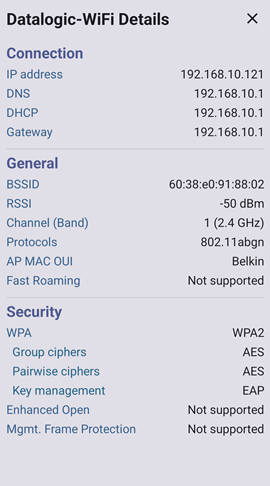
Access Point Details
This screen displays detailed information for a specific access point. The title displays the SSID of the specific access point. You can go back to the previous screen by tapping the "X" in the upper right corner, or the Android Back button. The information is shown in a scrollable list and organized into several groups.
-
Connection: This section is only visible if the device is connected to the displayed access point.
-
IP Address: This is the current IP address assigned to the device.
-
DNS: This is the IP address of the domain name server.
-
DHCP: This is the IP address of the DHCP server.
-
Gateway: This is the IP address of the gateway server.
-
-
General
-
BSSID: This uniquely identifies the access point in the list.
-
RSSI: This is regularly updated to report the current RSSI value of the access point. If the access point is out of range, this field displays "Offline".
-
Channel (Band): This is regularly updated to display the Wi-Fi channel and band currently being used to communicate with the network. If the access point is out of range, this field displays "Offline".
-
Protocols: This displays the 802.11 protocols available from the access point.
-
AP MAC OUI: This is the manufacturer name from the Unique ID of the access point's MAC address.
-
Fast Roaming: This field shows the access point's support for Fast Roaming.
-
-
Security
-
WPA 2/1: These fields show support for each of the security programs.
-
Group ciphers: This displays ciphers supported for broadcast packets.
-
Pairwise ciphers: This displays ciphers supported for unicast packets.
-
Key management: This shows the supported methods for managing security keys.
-
Enhanced Open: This field shows support for Opportunistic Wireless Encryption.
-