Ping Tab
Overview
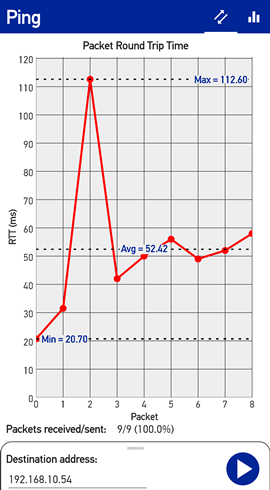
The Ping tab allows the user to perform a continuous ping to a network address. It can be used to test the basic network connection state. It contains a graph of ping results over time, a summary of ping success rate, and controls to change the ping behavior.

Ping Controls
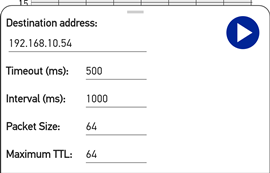
The sheet with all the ping controls is at the bottom of the display and can be expanded by dragging up the gripper at its top center. It can be collapsed by dragging it down. The following controls are available:

-
Destination address: This is the network address which will be pinged. It can be an IP address (e.g. 192.168.10.54), or a URL (e.g. mydomain.com). The default value is the IP address of the current connection's gateway server.
-
Timeout (10 - 60000 ms.): This is the time to wait for a response to the ping before declaring the ping attempt to be unsuccessful.
-
Interval (100 - 60000 ms.): This is the time to wait between successive ping attempts.
-
Packet size (16 - 4096): This is the number of bytes of data padding which is added to the ping packet on each attempt. It can be used to represent different sized network packets in applications.
-
Maximum TTL (1 - 128): This specifies the maximum Time To Live assigned to each ping attempt. It is the maximum number of routers that may be used to deliver the network packet to the destination address before it is discarded.
While ping data is being collected, the values of these controls cannot be changed.
Note: In the current version, the time values are rounded up to seconds.
Taking Ping Measurements
Before you begin taking ping measurements, set the destination address to something that you believe can be reached from the device on the network it is currently connected to. You may also change the other controls from their default values.
Tap the blue Play button on the control sheet to begin a ping session. When tapped, the control sheet will automatically collapse to reveal the graph results, and the Play button will change to a Stop button. To stop the ping session, tap this button again.
While a ping session is active, the results are displayed in the graph and status line beneath it. The graph displays the ping attempt on the horizontal axis, and the round trip time for each ping is shown on the vertical axis. Any gaps in the graphed line represent one or more pings that did not respond or exceeded the timeout.
In addition to the individual ping response times, the graph also displays statistical information. Dotted lines display the minimum, maximum and average response times for the session. A status line beneath the graph summarizes the total success rate of the pings in the current session. It shows the number of successful pings, ping attempts, and success rate as a percentage.